Solace Community is getting a facelift!
On March 3rd we will be starting the process of migrating Solace Community to a new platform. As a result, Solace Community will go in to a temporary read-only state. You will still be able to come onto Solace Community and search through posts to find answers, but you won't be able to ask questions, post comments, or react in any way.
We hope to have the migration complete by Wednesday March 5th (or sooner), so please keep an eye out!
Distributed Tracing Context Propagation

Hello Solace-Community,
I am currently playing around with the distributed tracing and telemetry settings.I tried to create a simple use case with a sender, two static bridged Brokers and a receiver.
Both sender and receiver are SDKPerf (sdkperf-jms-8.4.9.27). All of them are connected to the same opentelemetry collector which itselfs transfers the traces to a backend (Grafana Tempo).
My issue is, that this setup creates two traces per message send, each with two spans. One trace is for the sending & receiving sdkperf, one trace is for the two brokers. I assumed that it would be possible to use the same context accross the complete message transfer to get one trace in the end which contains 4 spans (sender -> broker a -> broker b -> receiver).
I start the receiver sdkperf like this (the SOLACE_VM_ARGS are the same for the sender - except the service.name)
export SOLACE_VM_ARGS=""
export SOLACE_VM_ARGS="-javaagent:`pwd`/lib/opentelemetry-javaagent.jar"
export SOLACE_VM_ARGS="$SOLACE_VM_ARGS -Dotel.javaagent.extensions=`pwd`/lib/solace-opentelemetry-jms-integration-1.0.0.jar"
export SOLACE_VM_ARGS="$SOLACE_VM_ARGS -Dotel.traces.exporter=otlp"
export SOLACE_VM_ARGS="$SOLACE_VM_ARGS -Dotel.metrics.exporter=none"
export SOLACE_VM_ARGS="$SOLACE_VM_ARGS -Dotel.instrumentation.jms.enabled=true"
export SOLACE_VM_ARGS="$SOLACE_VM_ARGS -Dotel.javaagent.debug=false"
export SOLACE_VM_ARGS="$SOLACE_VM_ARGS -Dotel.propagators=solace_jms_tracecontext"
export SOLACE_VM_ARGS="$SOLACE_VM_ARGS -Dotel.resource.attributes=service.name=receiving_client"
export SOLACE_VM_ARGS="$SOLACE_VM_ARGS -Dotel.exporter.otlp.endpoint=http://localhost:4317"
export SOLACE_VM_ARGS="$SOLACE_VM_ARGS -Dotel.bsp.schedule.delay=500"
export SOLACE_VM_ARGS="$SOLACE_VM_ARGS -Dotel.bsp.max.queue.size=1000"
export SOLACE_VM_ARGS="$SOLACE_VM_ARGS -Dotel.bsp.max.export.batch.size=5"
export SOLACE_VM_ARGS="$SOLACE_VM_ARGS -Dotel.bsp.export.timeout=10000"
./sdkperf_jms.sh -cip=smfs://mybroker.example:55443 -sql=queuename -md -cu=user@vpn  -cp=password -jcf=connectionfactory
I assume the error comes from the
export SOLACE_VM_ARGS="$SOLACE_VM_ARGS -Dotel.propagators=solace_jms_tracecontext"
I tried different propagators, but with none I received the wished result.
I end up with the following result. Two traces - one for sending & receiving and one trace for the two brokers (sandbox1 and sandbox2).
Maybe something helpful(?) - I can see inside the message on the receiving end that the Message contains the TraceID of the sender as JMS and User Property inside of the traceparent. I assume that is why sender & receiver can be grouped as one trace.
Here is the example message from the screenshot above (removed a couple of lines to make it more compact).
^^^^^^^^^^^^^^^^^^ Start Message ^^^^^^^^^^^^^^^^^^^^^^^^^^^

JMSProperties:                          {traceparent:00-b972f11977dcbeca0be7140ea4745bd6-ea9df81b1915ea5b-01,JMS_Solace_DeliverToOne:false,JMS_Solace_DeadMsgQueueEligible:false,JMS_Solace_ElidingEligible:false,Solace_JMS_Prop_IS_Reply_Message:false,JMSXDeliveryCount:1}
Priority:                               4
Class Of Service:                       USER_COS_1
DeliveryMode:                           PERSISTENT
Message Id:                             84987
User Property Map:                      1 entries
  Key 'traceparent' (String): 00-b972f11977dcbeca0be7140ea4745bd6-ea9df81b1915ea5b-01
Replication Group Message ID:           rmid1:1de21-6cef0c9e5e5-00000000-00014bfb
Tracing TransportContext:               {traceId=22da78539542d9976a037df8d50f84d6, spanId=a73ba437e9dd2910, sampled=true, traceState=}
^^^^^^^^^^^^^^^^^^ End Message ^^^^^^^^^^^^^^^^^^^^^^^^^^^
Comments
-
Hi @jfg1306!
Can you share the details of your sdkperf settings?
What are the command line parameters you use for publishing and subscribing?
Also, what broker version are you using and how is your vpn bridge setup?
What are the subscriptions and where are they configured (queue or direct)?
Christian
0 -
Hi @ChristianHoltfurth ,
sure I can try to share as many details as possible :-)
I use the sdkperf sdkperf-jms-8.4.9.27 which I downloaded from products.solace.com under the path products/10.17GA/Tools/sdkperf_jms/Current/8.4.9.27/
The SOLACE_VM_ARGS I am using before running the sdkperf are listed above. The parameters I use are the following for
Publishing (I replaced the actual values with placeholders <>):
./sdkperf_jms.sh -cip=smfs://<Broker#1>:55443 -ptl=<mytopic> -mn=1 -msa=100 -mt=persistent -cu=<user>@<vpn> -cp=<password> -jcf=<connectionfactory>
Subscribing (Again, placeholders for actual values):
./sdkperf_jms.sh -cip=smfs://<Broker#2>:55443 -sql=<myqueue> -md -cu=<user>@<vpn> -cp=<password> -jcf=<connectionfactory>
For this usecase I setup two new Brokers in Version 10.2.1.32.
Any specific information you need about the Bridge Setup ?
I tried to create a draw.io image of the setup I have. I use queues for the subscribtions, no direct message transfer. The bridge is setup as unidirectional - so only Broker#2 has established a connection to Broker#1.
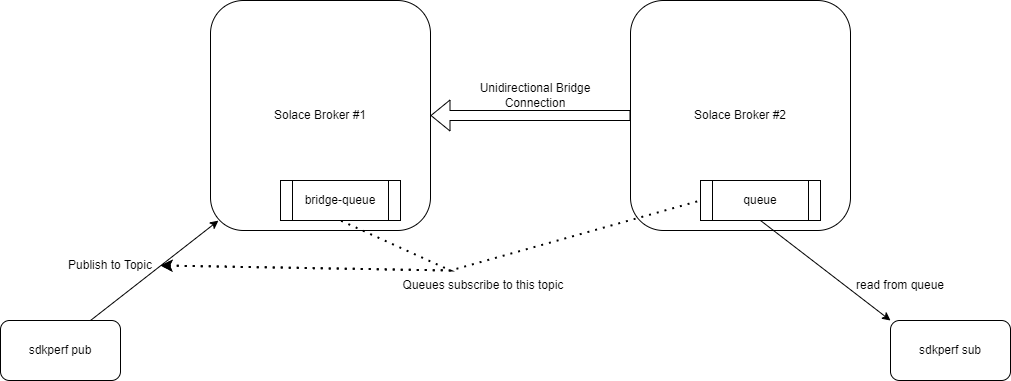
The message transfer works as expected in the setup. So
- sdkperf publish to a topic on Broker#1
- On Broker#1 is the bridge queue which subscribes to this topic
- Message goes through the Bridge onto Broker #2 where a queue lives which subscribes to the topic
- sdkperf subscribes to this queue
Greetings,
Jan-Filip.
0 -
Hi Jan-Filip,
I have tested a similiar setup and Stack IT Argus Service as observability tool.
I am getting the expected end-to-end trace from publisher to consumer:

My assumption is that the context propagation integration of the Solace JMS API does not work in your case, because you get different trace ids for clients and Solace event brokers.
I have not tested to use a connection factory, but I think this should not make any difference. Your commands look good so far.
That are my commands that I use for the publisher for example:
java -cp dt-sol-jms-example-1.0.0-SNAPSHOT-jar-with-dependencies.jar
     -javaagent:`pwd`/1.19.0/opentelemetry-javaagent.jar
     -Dotel.javaagent.extensions=`pwd`/solace-opentelemetry-jms-integration-1.0.0.jar
     -Dotel.traces.exporter=otlp
     -Dotel.metrics.exporter=none
     -Dotel.instrumentation.jms.enabled=true
     -Dotel.javaagent.debug=false
     -Dotel.propagators=solace_jms_tracecontext
     -Dotel.resource.attributes=service.name=time_event_publisher
     -Dotel.exporter.otlp.endpoint=http://192.168.100.140:4317
     -Dotel.bsp.schedule.delay=500
     -Dotel.bsp.max.queuesize=1000 -Dotel.bsp.max.export.batch.size=5 -Dotel.bsp.export.timeout=10000 com.solace.samples.dt.jms.example.TimeEventPublisher <HOST>:55555 <user>@<vpn> <password>
This looks also similiar to your ARGS. I assume it is more a version compatibility issue.
Can you make sure that you follow the following compatibility matrix?
I am using this integration for Solace JMS API:
https://mvnrepository.com/artifact/com.solace/solace-opentelemetry-jms-integration/1.0.0
And I am using Solace JMS API in version 10.17 with the collector version that is part of the distributed tracing EA version.
Can you check your versions of those components and give feedback?
Thanks,
Alexander
1 -
Hello Alex,
thank you for your feedback. Okay, so now I totally assume that the error is on my end.
I checked the compability matrix you provided aswell as the libraries which are in use.
For the components I have:
- Broker#1 is version 10.2.1.32
- Broker#2 is version 10.2.1.32
- OpenTelemtry Collector is otel/opentelemetry-collector-contrib:0.68.0
- PubSub+ Messaging API for JMS - I am using the sdkperf from GA10.17
- PubSub+ OpenTelemetry Integration for Solace JMS API: I am using version 1.0
- OpenTelemetry Instrumentation for Java: I am using version 1.19.0
I also compared the freshly downloaded md5 sums from the maven with the libs provided in the sdkperf and they are the same. The first md5sum is the one downloaded from maven, the second one (with lib/) is the one coming with sdkperf.
filip@SIT-:~/solace-sdkperf-jms/send$ cat opentelemetry-instrumentation-api-1.19.0.jar | md5sum
c5c8c6c8a769f73b8eeabc7e4a16469b  -
filip@SIT-:~/solace-sdkperf-jms/send$ cat lib/opentelemetry-instrumentation-api-1.19.0.jar | md5sum
c5c8c6c8a769f73b8eeabc7e4a16469b  -
filip@SIT-:~/solace-sdkperf-jms/send$ cat solace-opentelemetry-jms-integration-1.0.0.jar | md5sum
508b616474f74d4b3469c93599cbd28f  -
filip@SIT-:~/solace-sdkperf-jms/send$ cat lib/solace-opentelemetry-jms-integration-1.0.0.jar | md5sum
508b616474f74d4b3469c93599cbd28f  -
The only - main difference - I can currently see would be that I am using sdkperf and you are using a custom java programm
com.solace.samples.dt.jms.example.TimeEventPublisher
I sadly do not have access to the distributed tracing EA version. Maybe can you check your example with sdkperf if it still works as expected ? Or you can somehow provide me your example setup so I can test it with my Broker setup to see if that makes any difference.
Greetings,
Jan-Filip
0 -
Hi Jan-Filip,
I believe your sdkperf version is probably predating the release of distributed tracing and context propagation. Can you check if you have access to a newer/latest version?
There's also a special version that was made available during our DT early access program that you could use, please see https://codelabs.solace.dev/codelabs/tracing-ea/#1 for details.
Cheers,
Christian
0 -
Hi Christian,
I contacted Alexander and asked him to provide me access to the special DT EA version.
But for sdkperf I am using the latest version. At least which is available to me.
This is my products Tools list available

Only in 10.17GA I can find the sdkperf_jms. Here I am using the one from "Current" - 8.4.9.27 (seems to be the latest)

In 10.18GA I only have sdkperf_cs

In 10.19GA it is the same

Or am I missing something and the tool is provided in a later version through other paths ?
Greetings,
Jan-Filip.
0 -
Hi Jan-Filip,
I'll double check whether there's an offically released version of sdkperf that does support context propagation for DT.
Christian
1 -
Hi Jan-Filip,
Just to follow up on the sdkperf version.
The latest sdkperf-jms-8.4.9.27 should support context propagation.
The flags starting with -tcc are for context propagation.
It might be case of whether you are setting the right flags, provide the right instrumentation on sdkperf.
Did you compare it with the codelab, I linked to?
0 -
Hello Christian & Alex,
thank you very much for your patience and help.
Now it works! The hint from Christian with the "-tcc" flags was the push in the right direction. Instead of using the example from the codelab which uses a older version of sdkperf I needed to use the "new" tcc flags provided by sdkperf.
Now I get the expected result and have a trace which spans from start to finish :-)

If someone else has struggles like I do - here is the solution that worked in the end.
On the sender sdkperf:
./sdkperf_jms.sh \
    -cip=smfs://<brokerurl>:55443 \
    -ptl=<topicname> \
    -mn=1 \
    -msa=100 \
    -mt=persistent \
    -cu=<user>@<vpn> \
    -cp=<password> \
    -jcf=<connectionfactory> \
    -tcc \
    -tecip="http://<url to your opentelemetry collector>:4317"
On the receiver sdkperf:
./sdkperf_jms.sh  \
    -cip=smfs://<brokerurl>:55443 \
    -sql=<queue> \
    -cu=<user>@<vpn> \
    -cp=<password> \
    -jcf=<connectionfactory> \
    -tcrc \
    -tecip="http://<url to your opentelemetry collector>:4317"
Just a final hint maybe - if you are using the "-tmd" flag provided by sdkperf on the receiver
  -tmd              Trace message dump. When printing messages, the payload will be decoded
                    from the protobuf to show trace data (Also sets -md to true)
you will get an error
2023-01-13 09:12:39,997 [Context_2_jms_1_ConsumerDispatcher] ERROR [com.solacesystems.jms.impl.JCSMPMessageListener] Error on async receiving of BytesXMLMessage
java.lang.NoClassDefFoundError: com/google/protobuf/MessageOrBuilder
Not sure if this lib can not be added to sdkperf because of licensing issues but I had to manually download and add it to my lib directory from here Maven Repository: com.google.protobuf » protobuf-java (mvnrepository.com)
But even after you add it, you still receive an error
2023-01-13 09:11:43,646 [Context_2_jms_1_ConsumerDispatcher] ERROR [com.solacesystems.pubsub.sdkperf.core.AbstractClient] Failed to parse trace:
com.google.protobuf.InvalidProtocolBufferException: While parsing a protocol message, the input ended unexpectedly in the middle of a field.  This could mean either that the input has been truncated or that an embedded message misreported its own length.
Not sure if I still did something wrong - but it was not important for me. I just did not use the flag and everything else worked as expected. So I am happy ;-)
Greetings,
Jan-Filip.
1 -
Hi Jan-Filip,
Congratulations, you found a hidden feature that even I didn't know about! ;)
Joke aside, sdkperf as a receiver isn't really meant to be used to try to parse messages. The most you get with regards to functionality for displaying messages is a raw dump via the ´-md´ flag (message dump). I was told by one of our engineers that the flag you found was added for some internal debuggin purposes (related to distributed tracing) and that it isn't meant to be used to parse messages on the receiver side.
So if you are using it and found a way to parse messages in creative ways - well done, but -, please be aware that it's an undocumented ´internal´ feature and don't rely on it staying unchanged (or included) in future versions. :)
Best regards,
Christian
0 -
Hi Jan-Filip,
Great to see that you got sdkperf and context propagation running!
FYI...Solace has a great new codelab to get everyone going with context propagation that includes JMS clients as opposed to sdkperf. It's designed to get you up and running faster than before and provides some code that you can take and modify as an auto-instrumented JMS example.
Check it out here: https://codelabs.solace.dev/codelabs/dt-otel/
Regards,
Rob Tomkins
3


Categories
