HA redundancy - Monitoring node issue

madhu
madhu Member Posts: 13

I followed the steps documented in the HA redundancy section, both the primary and backup nodes are online and I can see the redundancy working.

Monitoring node is offline, the show redundancy group on monitoring node shows all nodes as offline.


I tried multiple times the behaviour is consistent, not sure what I am missing.

Thanks

Madhu

Comments

  • arih
    arih Member, Employee Posts: 125 Solace Employee

    Hi @madhu

    It'd be helpful to share more details, like what is your setup looks like, is it a Kubernetes-based, or you;re doing multiple VMs or EC2 instances maybe?

    And a few screenshots or log snippets would be great too.

  • madhu
    madhu Member Posts: 13

    Thanks Arih for quick reply.

    3 machines ec2 instances.

    Primary

    Backup


    Monitoring Node


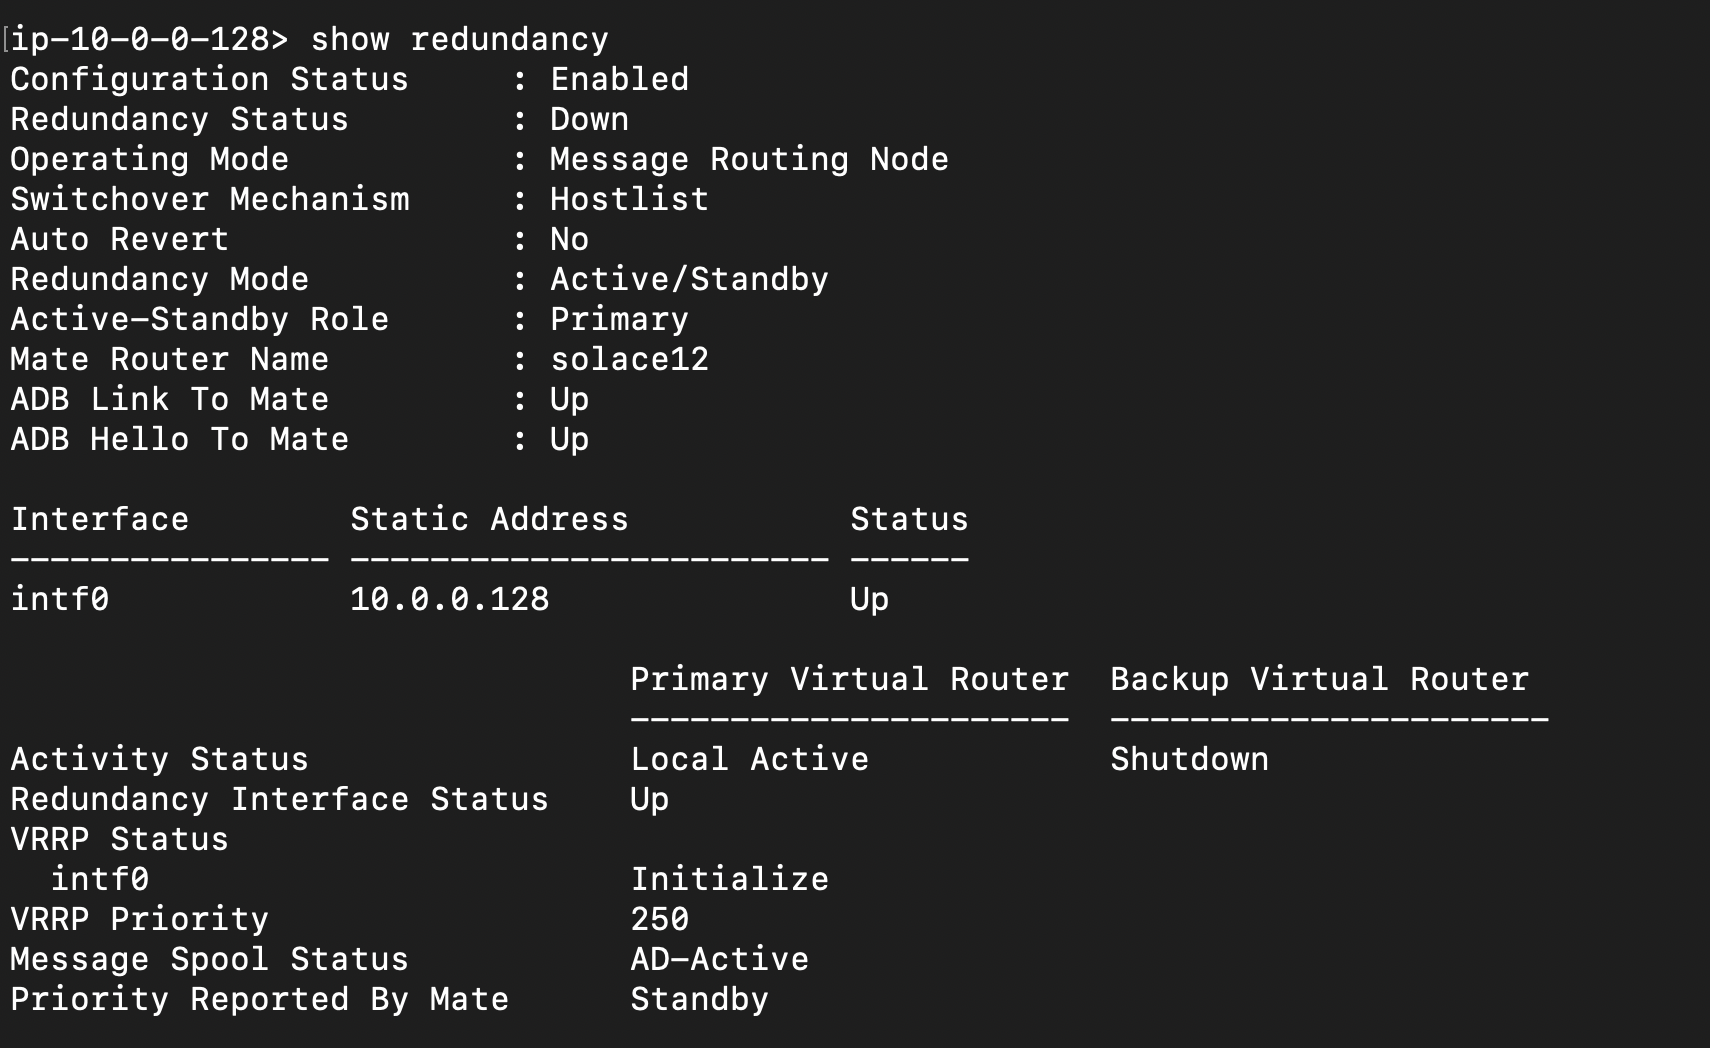
    Primary node


    Backup node


    Debug on monitoring node


    Thanks

    Madhu

  • arih
    arih Member, Employee Posts: 125 Solace Employee

    that's awesome!

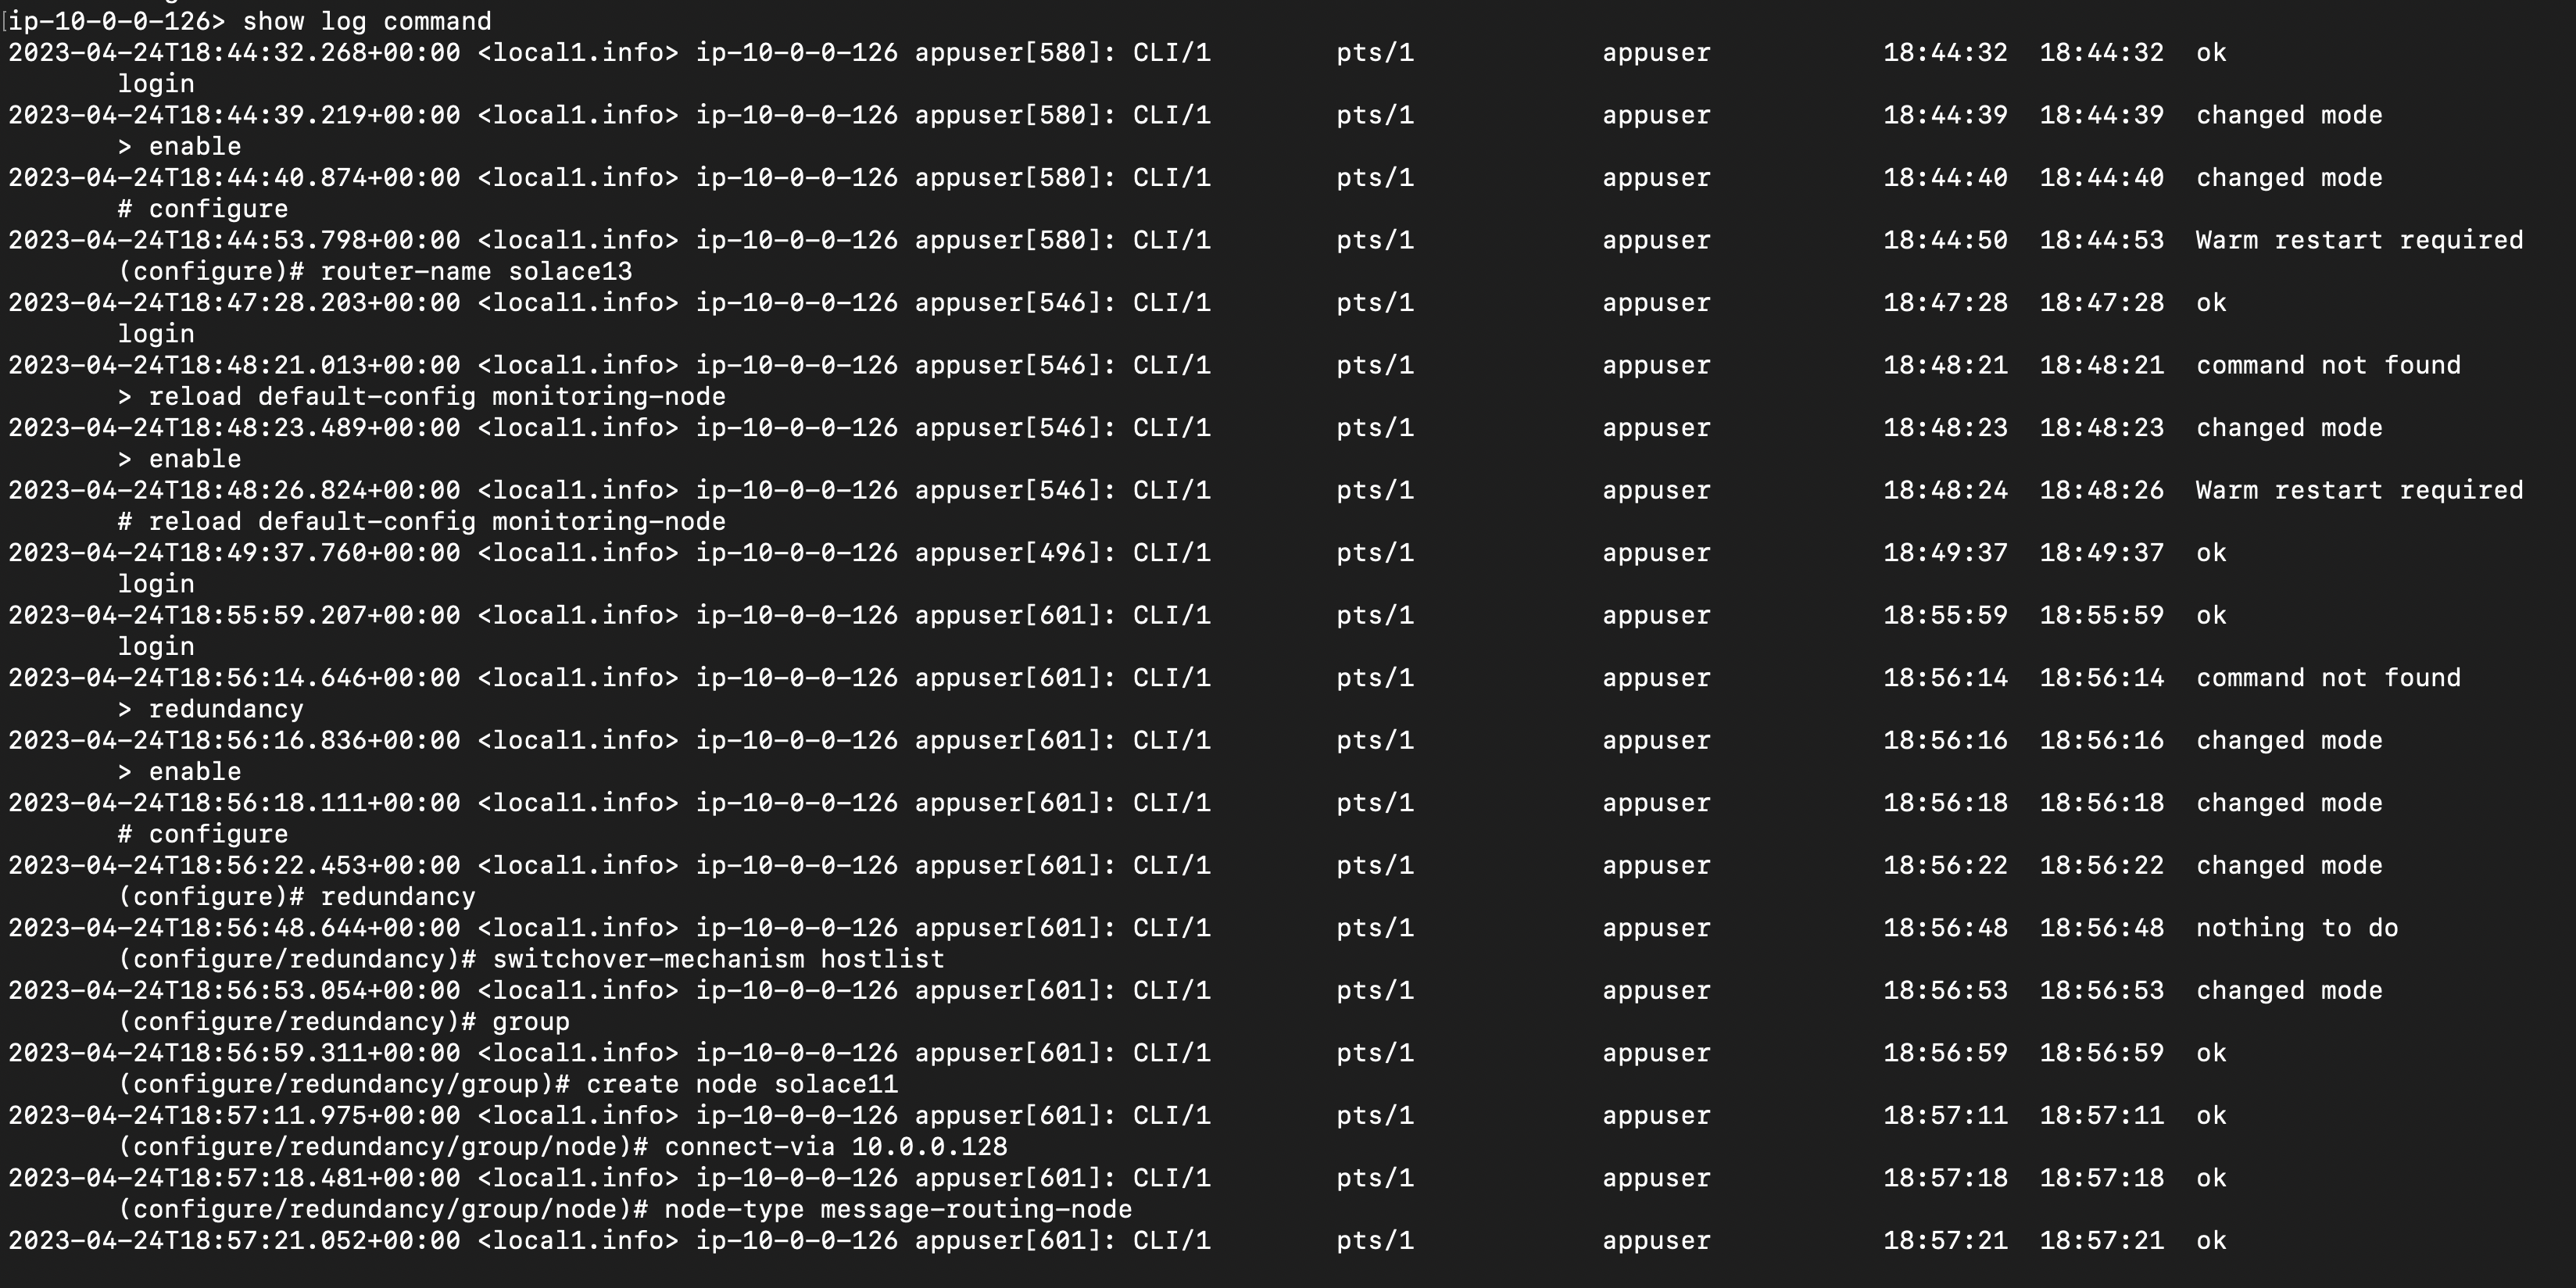
    can you also share the content of command.log from the monitor node.

    also, did you somehow changed hostname or IP address for the monitoring node sometime after setup?

  • madhu
    madhu Member Posts: 13

    No its new setup, no changes to ip or hostname.


  • madhu
    madhu Member Posts: 13

    Versions I have tried 10.2.1.51 and 10.3.0.32, AMI from community standard instances.


    aws-marketplace/solace-pubsub-standard-10.3.0.32-amzn2-15.2.0-ac3bbfe4-a7d2-4591-bbc5-f43908c43764


    Thanks

    Madhu

  • arih
    arih Member, Employee Posts: 125 Solace Employee

    noted, can you show us the output of this command from the monitor node as well as one of the pri/sec node?

    solace> show ip vrf management


  • madhu
    madhu Member Posts: 13

    Monitoring node


    Primary node:


  • arih
    arih Member, Employee Posts: 125 Solace Employee

    hmm, that looks correct.

    can we go back to command.log and show the full content from beginning?

  • madhu
    madhu Member Posts: 13

    Command log


    Thanks

    Madhu

  • arih
    arih Member, Employee Posts: 125 Solace Employee

    that looks good as well... I'm running out of ideas :)

    from the monitor node linux shell, are you able to ping 10.0.0.126 and 10.0.0.128?

  • madhu
    madhu Member Posts: 13

    Yes they are reachable, any specific ports other than documentation provided.. ? or this offline for monitor node has some bug?


    Thanks

    Madhu

  • madhu
    madhu Member Posts: 13

    I observe the below error message on the monitoring node debug log. Not exactly sure what does it mean, I just performed the steps provided in the documentation no customization performed on any node.


    2023-04-26T05:52:56.174+00:00 <local0.err> ip-10-0-0-126 appuser[387]: /usr/sw            ConsulFSM.cpp:860           (REDUNDANCY  - 0x0000000

    0) ConsulProxyThread(9)@controlplane(10)     ERROR  Could not determine self node configuration

    2023-04-26T05:52:57.175+00:00 <local0.err> ip-10-0-0-126 appuser[387]: /usr/sw            ConsulFSM.cpp:860           (REDUNDANCY  - 0x0000000

    0) ConsulProxyThread(9)@controlplane(10)     ERROR  Could not determine self node configuration

    2023-04-26T05:52:58.176+00:00 <local0.err> ip-10-0-0-126 appuser[387]: /usr/sw            ConsulFSM.cpp:860           (REDUNDANCY  - 0x0000000

    0) ConsulProxyThread(9)@controlplane(10)     ERROR  Could not determine self node configuration

    2023-04-26T05:52:59.177+00:00 <local0.err> ip-10-0-0-126 appuser[387]: /usr/sw            ConsulFSM.cpp:860           (REDUNDANCY  - 0x0000000

    0) ConsulProxyThread(9)@controlplane(10)     ERROR  Could not determine self node configuration


    Thanks

    Madhu

  • Aaron
    Aaron Member, Administrator, Moderator, Employee Posts: 652 admin

    I'm not sure either. You tried with two different versions and they both had the same issue? Sure all the firewall rules are correct..? TCP & UDP?

  • arih
    arih Member, Employee Posts: 125 Solace Employee

    hey @madhu ,

    can you check one more thing by issuing below command on all nodes:

    solace> show router name

  • madhu
    madhu Member Posts: 13

    Wow arih, that did the trick.

    My mistake some reason I missed updated the router-name in monitoring node. I did it consistently in all my attempts :(.


    Thanks

    Madhu

  • arih
    arih Member, Employee Posts: 125 Solace Employee

    Hahaha, no worries, that's muscle memory I guess ;)

    Good to hear it got solved!


    As added note, there are options to use helm charts, docker compose, cloud formation, etc. that might help automate these steps. Or even better, just use solace.com/cloud if you just need a broker that just runs ;)

  • Aaron
    Aaron Member, Administrator, Moderator, Employee Posts: 652 admin

    @madhu glad you got it resolved!! 🙌🏼

    What was it before? And what did you have to change it to? I'm surprised there wasn't an easier error/status notification somewhere in CLI showing a mismatch or something.

  • madhu
    madhu Member Posts: 13

    I think i found the pattern, seems like when we change the node to monitoring node it overwrites the node-name.

  • madhu
    madhu Member Posts: 13

    @Aaron, no error on monitoring node. On messaging node we get error if node-name doesn't match.

  • Aaron
    Aaron Member, Administrator, Moderator, Employee Posts: 652 admin

    Looking at your CLI output, I can see you setting the router-name and then reloading the default config. Which essentially completely replaces all configuration with whatever is stored internally as default. So yeah, it would have overwritten the router name that you set.

    I've raised a documentation enhancement for the page you cited in your first post.